Quick Start#
Once installed, use the package by simply calling its functions after you have created a matplotlib plot.
Basic Example#
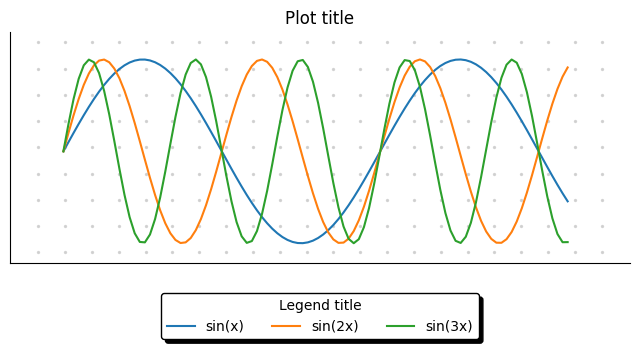
Here is an example comparing a standard matplotlib plot and the one enhanced with pimpmyplot:
import pimpmyplot as pmp
import matplotlib.pyplot as plt
import numpy as np

x = np.linspace(0, 10, 100)

plt.figure(figsize=(8, 3))
plt.plot(x, np.sin(x), label='sin(x)')
plt.plot(x, np.sin(2*x), label='sin(2x)')
plt.plot(x, np.sin(3*x), label='sin(3x)')

# Add pmp enhancements
pmp.bullet_grid(stepinch=.3)        # dotted grid similar to a bullet journal
pmp.remove_axis('top', 'right')     # remove axis in a simpler way
pmp.remove_ticks()                  # remove ticks in a simpler way
pmp.legend(loc='ext lower center', title='Legend title')  # better looking horizontal legend
plt.title('Plot title')
Result#